Here are the neighbourhoods in Leamington, Warwick and Kenilworth with the lowest Covid infection rates - and the two highest
and live on Freeview channel 276
Covid-19 cases have continued to fall in the Warwick district, with some wards now falling below 100 cases per 100,000 people.
Lillington now has the lowest rolling rate, with just 73 cases per 100,000, while Kenilworth as a whole has seen big drops.
Advertisement
Hide AdAdvertisement
Hide AdThe data covers the seven days up to February 2 and the rolling rate is the number of positive Covid-19 cases per 100,000 population, calculated by dividing the seven day count by the area population and multiplying by 100,000.
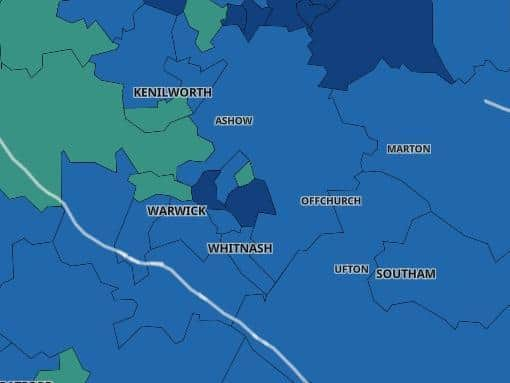

Overall, the Warwick district's rate is 157.2, down from 185 the previous week and 279 the week before.
Warwickshire's overall rate is 196.6, down from 245.7 the previous week.
Here are the lowest four areas with rolling rates under 100 per 100,000 people - and the two wards with the highest rates.
(Figures include the seven days up to February 2)
LOWEST RATES
Lillington
Total cases: 4
Advertisement
Hide AdAdvertisement
Hide AdThe rate has increased relative to the previous week by 2 (100.0%)
Rolling rate: 73.0
Warwick North
Total cases: 7
The rate has decreased relative to the previous week by 2 (-22.2%)
Rolling rate: 83.3
Kingswood & Leek Wootton
Total cases: 5
The rate has decreased relative to the previous week by 10 (-66.7%)
Rolling rate: 95.4
Kenilworth South
Total cases: 7
The rate has increased relative to the previous week by 3 (75.0%)
Rolling rate: 98
HIGHEST RATES
Leamington East & Sydenham
Total cases: 29
Advertisement
Hide AdAdvertisement
Hide AdThe rate has increased relative to the previous week by 3 (11.5%)
Rolling rate: 261.8
Leamington West & Milverton
Total cases: 23
The rate has increased relative to the previous week by 9 (64.3%)
Rolling rate: 238.3